How Layers Work
Understand building performance at the zone Level
Layers transforms floor plans into dynamic operational views by bringing zone-level system data directly into the spaces that matter. With multiple data points presented in one streamlined interface, it empowers teams to analyze faster, standardize visual workflows, and communicate building performance more effectively.
-
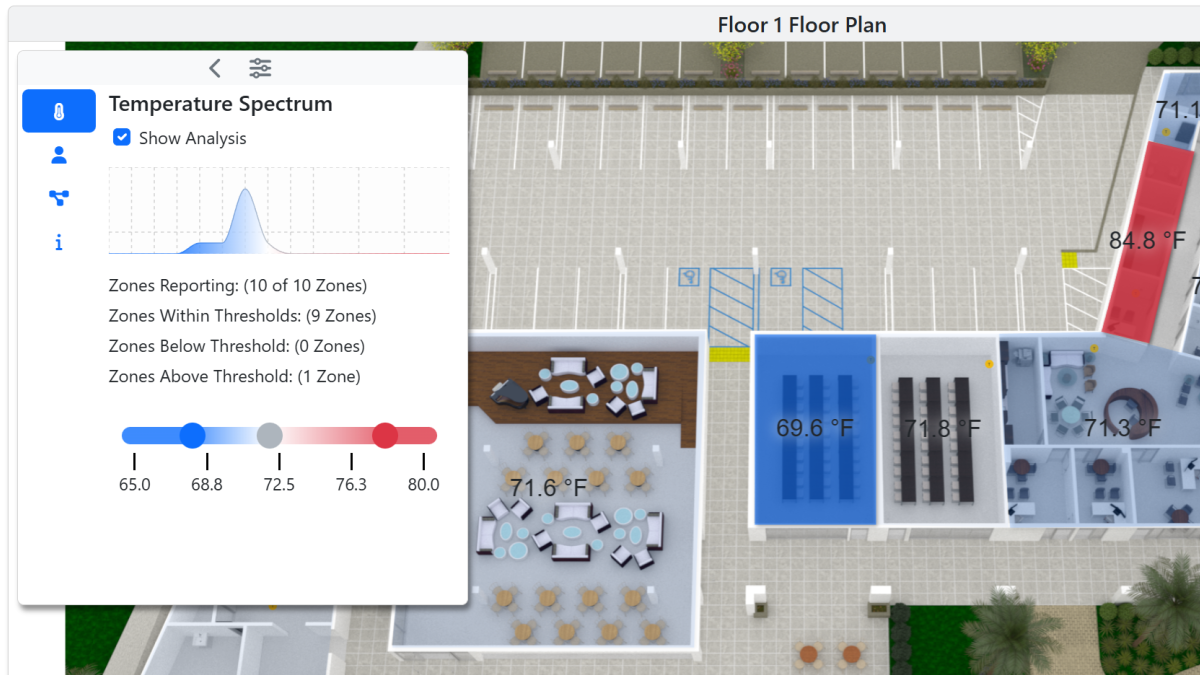
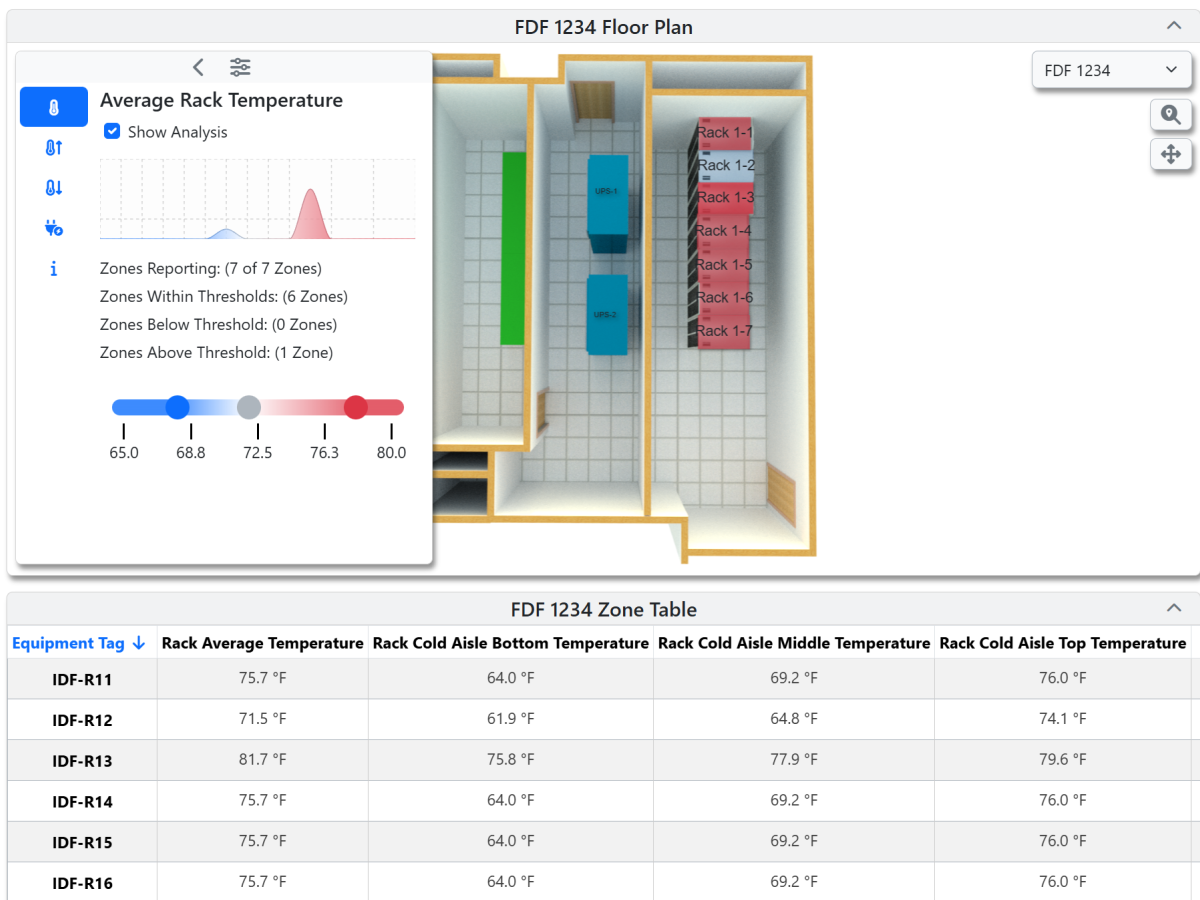
Temperature Spectrum Analysis
Visualize temperature variation across zones using spectrum-based color mapping to quickly identify inconsistencies and comfort issues.
-
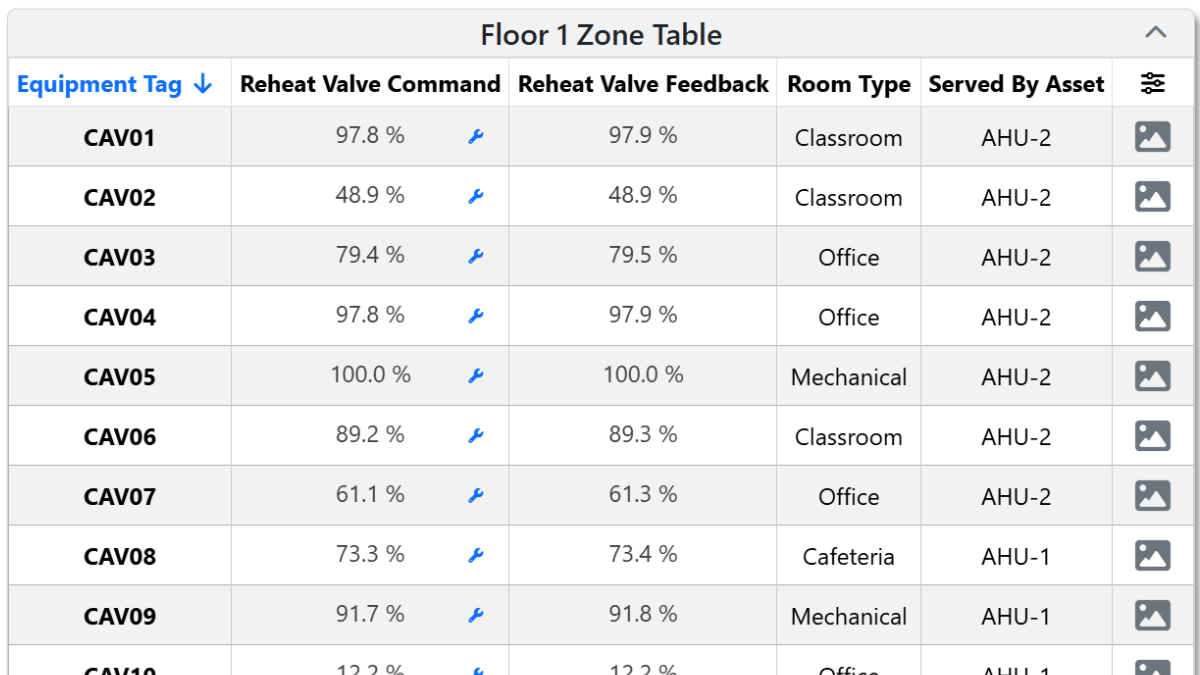
Integrated Zone Table
View live zone data in a centralized table that automatically subscribes to Niagara data, with configurable columns and filters for faster comparison.
-
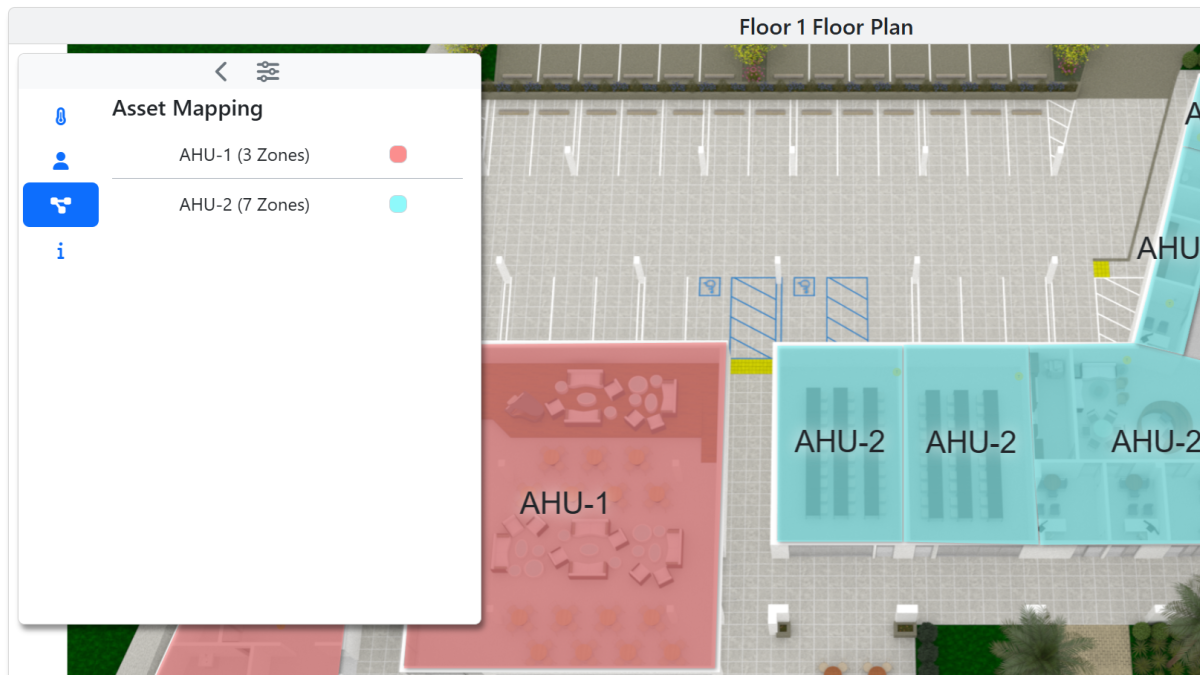
AHU Mapping
Understand how zones relate to air handlers by mapping system relationships directly within floor plan views.
-
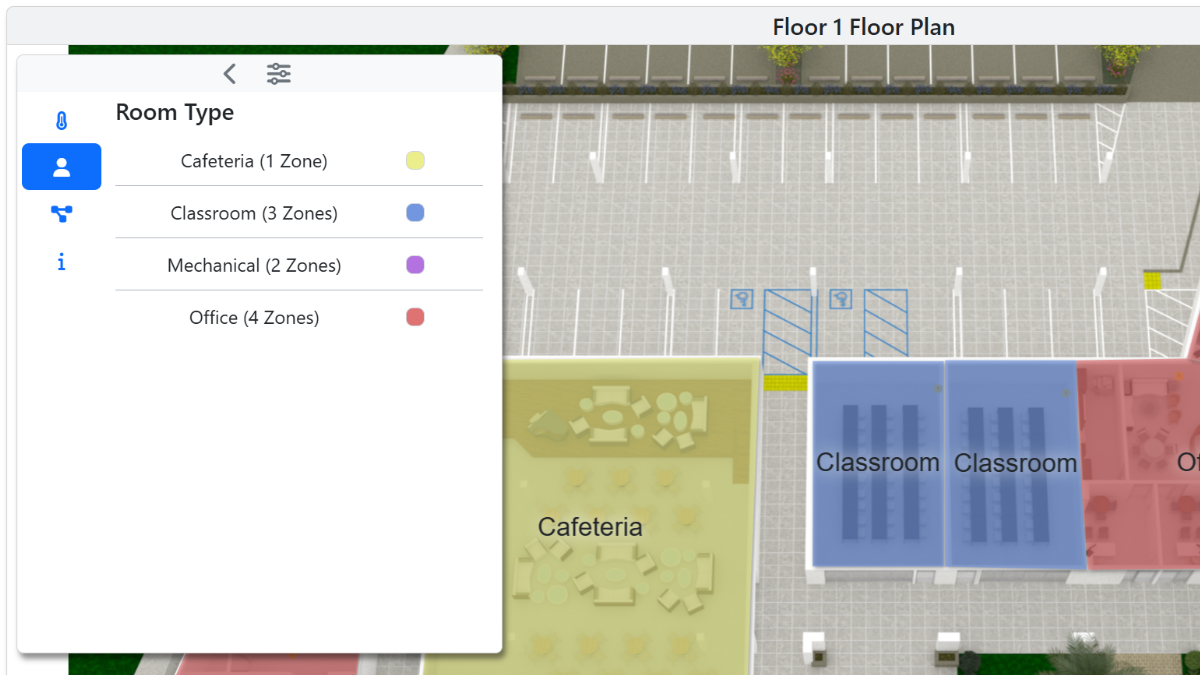
Room Type Mapping
Better understand the context of how rooms are utilized with color-coded room type mapping.
-
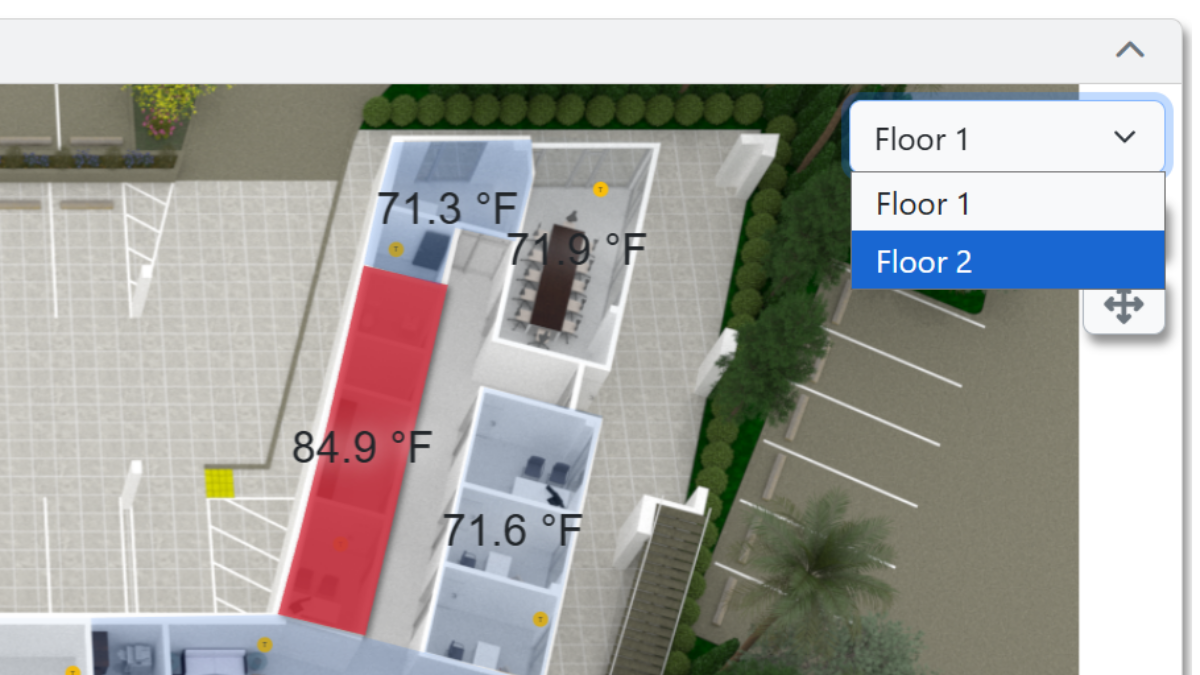
Multi-Floor View Port
On a single PX page, visualize all floors and zones in a given building.
-
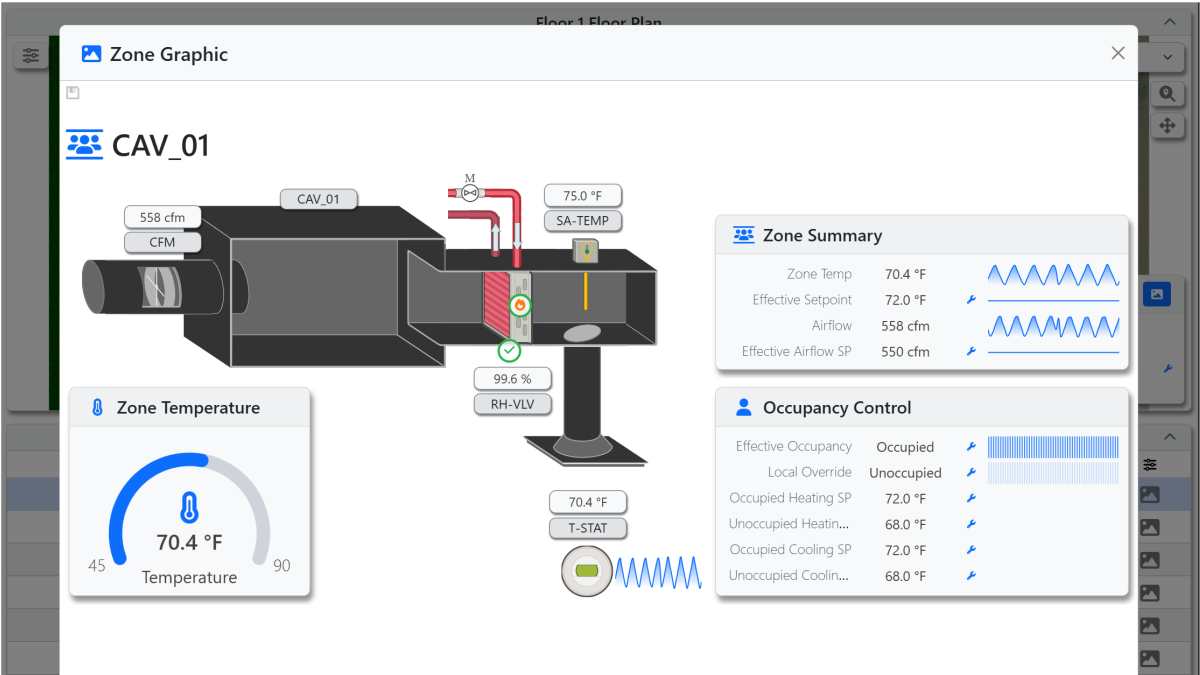
Zone Graphic Modals
Easily pullup individual zone graphics to dive deeper.
See Layers in action
Explore how Layers transforms floor plans into a practical tool for zone-level analysis and system understanding.
- Visualize zone-level performance directly within floor plan views
- Use spectrum-based color mapping to quickly identify temperature variation and comfort issues
- View all floors and zones for a building from a single PX page
- Turn static floor plans into dynamic, data-rich operational views
- Compare live zone data in a centralized table with configurable columns and filters
- Automatically subscribe to Niagara data for faster, more informed analysis
- Identify inconsistencies across zones without jumping between multiple graphics
- Accelerate troubleshooting with clearer building-wide visibility
- Map relationships between zones and air handlers directly within the floor plan
- Use color-coded room type mapping to better understand space usage and context
- Pull up individual zone graphics for deeper investigation when needed
- Connect spatial layout with system behavior for a more complete operational picture
- Help teams analyze conditions faster and communicate findings more clearly
- Reduce manual graphics effort with a more standardized visual workflow
- Improve understanding of how spaces and systems interact across the building
- Support quicker, more confident decisions with better visual context